1. Introduction: Why Debugging AI Workflows Matters in 2025
AI automation has unlocked incredible productivity in 2025—from auto-replying to emails to building intelligent customer support systems. But as workflows become more complex, debugging them has become just as important as building them. Whether you’re a freelancer managing client automations or a small business owner relying on tools like Zapier, Make, or Pipedream, knowing how to debug AI workflows is now a must-have skill.
Even with no-code and low-code tools, AI automations can break silently. One missed condition, outdated API key, or misfired trigger can halt an entire workflow—often without any visible sign. Worse, broken workflows can silently produce wrong results, like sending the wrong email to the wrong customer or summarizing data inaccurately. These issues can damage your credibility, waste time, and lead to costly errors.
Learning AI workflow troubleshooting helps you not only fix errors faster but also build more reliable systems from the start. The good news? You don’t need to be a developer to do it. With the right approach, even no-code users can debug AI workflows effectively—catching issues, diagnosing problems, and applying smart fixes before they cause trouble.
In this guide, we’ll walk through the most common AI automation issues, how to spot them early, and how to fix them using real-world examples. Whether you use ChatGPT, Zapier, Make, or Pipedream, this article will give you a practical roadmap to mastering the art of debugging your AI workflows.
2. Top Reasons AI Workflows Break (And How to Recognize Them)
Before you can fix a broken AI workflow, you need to understand why it’s failing. Whether you’re using Zapier, Make, Pipedream, or custom GPT-based automations, errors can creep in from various directions. Let’s explore the most common AI workflow errors, how to spot them early, and what they usually look like.
2.1 API Connection Issues
Most AI automations depend on third-party apps talking to each other—via APIs. If an app connection breaks due to expired tokens, incorrect credentials, or revoked permissions, your workflow can fail without warning.
Common signs:
- “Authorization failed” errors
- Silent skips in execution
- Webhooks not firing
2.2 Token and Quota Errors (Especially with GPT APIs)
Tools like ChatGPT, Claude, or Gemini rely on tokens and usage limits. If you exceed token length or hit your quota, the AI step can fail.
Error examples:
- “Exceeded token limit”
- “Quota reached”
- Empty or partial AI responses
2.3 Data Formatting Issues
Workflows often break when the data passed between steps is not in the expected format. This is especially true when moving between structured sources like Google Sheets and unstructured GPT prompts.
Look out for:
- “Unexpected input type”
- Date or number misinterpretation
- JSON parsing failures
2.4 Misconfigured Triggers
If the workflow trigger doesn’t fire, nothing else happens. This can be due to filter conditions not being met, wrong test data, or inactive triggers.
Red flags:
- No execution history
- Test triggers fail
- “Waiting for trigger” endlessly
2.5 Logical Errors and Misplaced Conditions
Even if every step technically works, faulty logic can lead to bad outputs. This includes incorrect “If/Else” logic, unhandled null values, or misaligned branching.
Examples include:
- AI responding with irrelevant text
- Skipping steps unexpectedly
- Emails sent to the wrong segment
2.6 Rate Limits or Platform Downtime
If you’re sending too many requests too fast, platforms may throttle you. Some APIs silently reject requests or delay processing.
Symptoms:
- Sudden slowdowns
- “429 Too Many Requests” errors
- Inconsistent execution success
Understanding these root causes is the first step in learning how to debug AI workflows effectively. Next, we’ll show you how to catch these issues early—before they spiral out of control.
3. Debugging Triggers: How to Catch Issues Early
A broken workflow often starts with a failed trigger. If the first step doesn’t fire correctly, the rest of your AI automation never gets a chance to run. This makes debugging triggers one of the most important steps when learning how to debug AI workflows effectively.
Why Triggers Fail
Triggers can break for several reasons:
- Filters or conditions aren’t met (e.g., “only trigger when status = approved”)
- Wrong field mapping from source apps
- Inactive or misconfigured webhook URLs
- Test data not matching real-world scenarios
In no-code tools like Zapier, Make, and Pipedream, these errors often go unnoticed until you check the logs.
Best Practices to Catch Trigger Issues Early
Here’s how to debug trigger-related issues before they cause downstream problems:
3.1 Run Manual Trigger Tests
Most tools allow you to manually test your trigger. In Zapier, use the “Test Trigger” button to confirm it’s pulling data. In Make (Integromat), run a manual scenario execution to watch for real-time activity.
3.2 Use Sample or Real Data
Many trigger failures happen because the test data is missing or doesn’t meet conditions. Always ensure you’re testing with realistic data samples.
3.3 Check Logs and Execution History
Most platforms offer detailed logs. These show whether a trigger fired, what data it received, and why it may have failed. Look for red flags like “No data found” or “Condition not met.”
3.4 Use Filters Sparingly (at First)
Overusing filters too early in a workflow can prevent triggers from firing. Start simple, then layer on logic once the basics work.
By understanding how triggers behave and where they commonly fail, you can save hours of troubleshooting later. Debugging triggers early is a core part of mastering AI workflow troubleshooting—and it sets the foundation for a reliable automation system.
4. Fixing Common AI Step Errors (ChatGPT, GPT-4, Claude, etc.)
Once your trigger works, the next most common failure point in AI automation is the AI step itself. Whether you’re using ChatGPT, GPT-4, Claude, or any other model, errors at this stage can derail the entire workflow. Learning how to fix AI automation errors in these steps is critical for anyone building advanced workflows.
Common Errors in AI Steps (and Why They Happen)
Token Limit Exceeded
Each AI model has a token limit—and if your input + expected output exceeds it, the request fails.
Fix: Use shorter prompts, trim large inputs, or break up data into smaller chunks. For long documents, use chunking techniques and looped summaries.
Output Formatting Failures
Sometimes the AI responds in an unexpected format, making the next step unreadable. This is common in workflows that pass AI-generated results to Google Sheets or another app.
Fix: Use clear formatting instructions in the prompt (e.g., “Respond in JSON format” or “Return only a list of bullet points”).
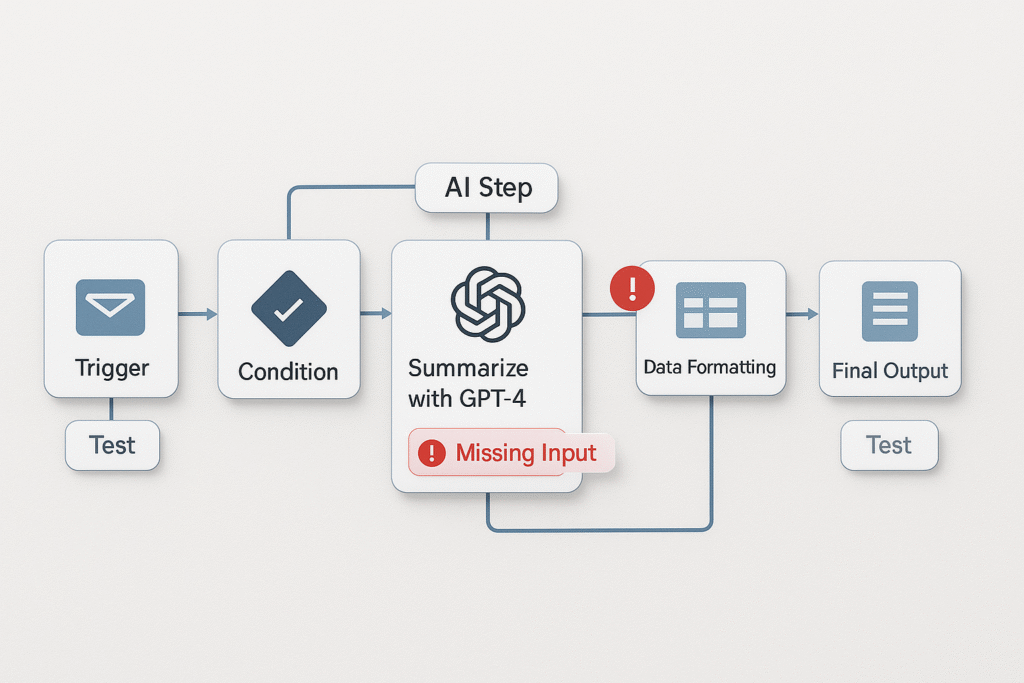
Missing or Broken Inputs
If an earlier step fails or doesn’t pass the correct data to the AI, your prompt might be incomplete or confusing.
Fix: Double-check field mappings. Most tools let you see exactly what data is sent into the AI step—use that to verify input quality.
Prompt Errors
Poorly written or vague prompts are a major source of gibberish, off-topic responses, or hallucinations.
Fix: Use structured, specific prompts. Add examples when possible. Test different phrasings in ChatGPT before embedding them into workflows.
Model Doesn’t Respond
This can happen if the API is overloaded, your API key is expired, or the tool hits a rate limit.
Fix: Retry with delay steps, refresh authentication, or monitor usage limits (especially with GPT-4 or Claude APIs).
By learning how to debug these AI workflow errors, you’ll prevent silent failures and improve output quality. Whether you’re using Zapier, Make, or a custom tool, these fixes help you confidently build smarter, more reliable automations.
5. Zapier-Specific Errors and How to Fix Them
Zapier is one of the most popular no-code automation tools—but it’s not immune to hiccups. If your AI workflows involve ChatGPT, webhooks, or other connected apps, you’ll likely run into Zapier-specific errors at some point. Knowing how to debug AI workflows in Zapier will save you hours of frustration.
Common Zapier Errors (And What They Mean)
“App returned ‘not found’” or “Invalid API Key”
This usually happens when an app integration is broken—perhaps due to expired credentials or revoked access.
Fix: Go to My Apps in Zapier and reconnect or reauthorize the app. If using a webhook or custom API, double-check the key or endpoint.
Webhook 400/500 Errors
These errors occur when the destination app rejects the request due to bad formatting, missing fields, or server issues.
Fix: Check the exact request sent via the “Zap History.” Ensure all required fields are correctly mapped and the format is valid (especially for JSON or URLs).
Field Mapping Failures
If Zapier can’t locate the correct data field, the step may fail or run with incorrect input.
Fix: Re-test previous steps to pull fresh data. Then, re-map fields carefully—especially when working with dynamic inputs from ChatGPT or Sheets.
By understanding these Zapier AI workflow troubleshooting tips, you can quickly isolate and resolve errors before they impact your entire automation chain. Don’t forget to use Zapier’s built-in “Run History” and “Test Action” features—they’re essential tools in your debugging toolkit.
6. Make.com (Integromat) Debugging Guide
Make.com (formerly Integromat) offers powerful, flexible automation with a visual interface—but that complexity also makes it prone to errors if you’re not careful. To truly master how to debug AI workflows, understanding Make.com’s debugging tools is essential.
Use Scenario Run Logs
Every scenario run generates a log showing which modules succeeded, failed, or were skipped. Open the Execution History to inspect each step in detail.
Color codes help spot issues fast:
- 🟢 Green = success
- 🟡 Yellow = warning
- 🔴 Red = failure (click to view the error message)
Inspect Each Module
Click into any module to see the actual input and output data. If your ChatGPT step returns gibberish or nothing at all, you can quickly check whether the input was formatted correctly—or if a previous step failed silently.
Re-run Individual Modules
One unique advantage of Make is the ability to replay only the failed module with the same or adjusted data. This helps you test fixes quickly without re-running the entire scenario.
Debugging Filters and Routers
If your workflow uses routers or filters, Make it a habit to validate each condition. One incorrect logic path can cause your AI step to be skipped entirely.
By leveraging these built-in debugging features, even non-developers can troubleshoot Make.com AI workflow errors confidently. Use real-time logs, test modules individually, and monitor color-coded outcomes to catch issues before they grow.
7. Pipedream Debugging Tips for Developers
For developers building advanced automations, Pipedream is a powerful platform—but its flexibility also means that debugging requires a bit more hands-on work. If you’re looking to fix AI automation errors or debug GPT-4 and API-based flows in Pipedream, here’s how to catch problems before they break your workflow.
Use Console Logs Generously
Pipedream allows you to add console.log() statements inside each step. Use this to log incoming data, outputs, and any computed variables. This is especially helpful when troubleshooting ChatGPT step failures or malformed API requests.
Check Step-by-Step Execution
When a workflow runs, Pipedream provides a real-time execution log for every step. You can inspect:
- What data came in
- What was returned
- If an error occurred (and why)
Look for red error flags or blank outputs that may hint at broken logic or empty inputs.
Break Down Large Workflows
If you’re chaining many tools together, debugging becomes easier when you modularize your automations. Build and test one component at a time, especially with AI steps.
Visualize API Requests
Pipedream’s UI shows both HTTP request/response bodies. If you’re integrating OpenAI, Claude, or third-party APIs, this makes it easier to spot malformed headers, auth issues, or data format problems.
If you’re a developer using Pipedream, these tips will help you quickly debug AI workflows and avoid common automation fails—especially in GPT-based integrations.
8. Best Practices to Minimize Future Errors
While debugging is essential, the smartest approach is designing your AI workflows to avoid errors before they happen. Whether you’re building with Zapier, Make, Pipedream, or GPT-based tools, applying these best practices can drastically reduce failure rates and save hours of troubleshooting.
Start Small, Scale Gradually
Avoid building complex multi-step workflows all at once. Begin with a simple, testable version—just trigger, action, and AI step—then layer on logic and conditions as you validate each stage.
Always Use Default or Fallback Values
Missing data is a common cause of AI workflow errors. Add fallback text (e.g., “Not available”) when mapping dynamic fields. Many tools like Zapier and Make support default values directly in the editor.
Add Error-Handling Steps
Use native features like Zapier’s “Paths” or Make’s “Error Handlers” to catch and reroute failed steps. You can also send alerts (via email or Slack) when something breaks, so you catch it early.
Maintain Version Control
Before making changes to a working workflow, duplicate it or save a version snapshot. This gives you a rollback point if new edits introduce bugs.
Keep a Bug Log
Create a simple doc or spreadsheet where you log each bug, its fix, and the affected step. This not only builds a personal knowledge base but speeds up future AI workflow debugging.
By proactively designing with these habits in mind, you’ll minimize common automation issues and keep your workflows stable—even as they grow more advanced.
9. Debugging Checklist (Free Template/Printable)
To make debugging AI workflows easier and repeatable, here’s a compact checklist you can use every time an automation misbehaves. Whether you’re using Zapier, Make, Pipedream, or GPT-based tools like ChatGPT or Claude, this list covers the most common causes of failure—and how to fix them fast.
Test Each Step Manually
Use built-in “Test” buttons or manual triggers to validate each module before running the full workflow.
Check Tool Logs
Always review execution logs or run history. These usually reveal error messages, skipped steps, or misfired conditions.
Validate API Keys and Auth
Expired tokens or revoked app access are common culprits—re-authenticate your integrations if needed.
Inspect Inputs and Outputs
Ensure data from previous steps is passed correctly. Look for empty values, broken fields, or unexpected formatting.
Handle Empty or Missing Data
Set defaults or use fallback values to prevent AI or downstream steps from failing due to missing content.
Add Delays Where Needed
Use short delay steps when APIs need time to respond, especially in chained automations.
Log and Document Every Error
Track what went wrong, what fixed it, and any lessons learned—build your own troubleshooting knowledge base.
10. Conclusion: Mastering the Art of Debugging AI Workflows
In the fast-evolving world of automation, learning how to debug AI workflows is no longer optional—it’s a critical skill. Whether you’re a freelancer automating tasks for clients, a small business owner streamlining operations, or a developer scaling complex systems, understanding common AI automation issues and how to fix them gives you a serious edge.
From handling API errors in Zapier and Make to fixing token limits and formatting bugs in ChatGPT or Claude, debugging is what turns an average automation into a dependable one. And the good news? You don’t have to be a coding expert to master it.
By following structured practices—like checking logs, validating inputs, and using fallback logic—you’ll gain the confidence to build smarter, more resilient workflows. Use this guide and checklist as your go-to toolkit for AI workflow troubleshooting in 2025 and beyond.
Have your own debugging tip or horror story? Drop it in the comments—we’d love to learn from your experience. And remember: even in the world of no-code, thinking like a debugger turns you into a pro.